New Google APIs detect solar energy, pollen and air quality
August 29, 2023
0
Developers can get started today with three new APIs focused on sustainability. During the Google Cloud Next event, the annual mecca for developers working within Google Cloud Platform
Developers can get started today with three new APIs focused on sustainability.
During the Google Cloud Next event, the annual mecca for developers working within Google Cloud Platform (GCP), the search giant is unveiling a suite of new APIs focused on sustainability. An API bridges the gap between different systems and devices. For example, a mobile app can exchange data with a web server via an API.
Developers (and organizations) can now use APIs powered by Google Maps to measure real-time solar energy potential, air quality, and pollen count. The search giant hopes to bring together individuals, cities and partners to remove a gigatonne of CO2 from the air annually by 2030.
efficiency of solar panels
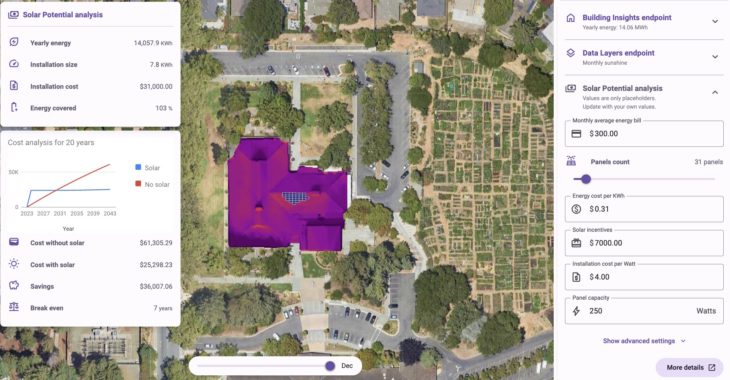
What originally began as Project Sunroof in 2015, developers can use the new API to measure how much solar panels can generate in 40 countries around the world. The Google team trained an AI model to use satellite photos to determine the exact angles and pitches of a roof.
The AI model also takes into account the shadow of any nearby trees and combines this with historical weather data and current energy prices. This gives both installers and homeowners the opportunity to transparently assess how efficient solar modules are in which situation.
Air quality in real time
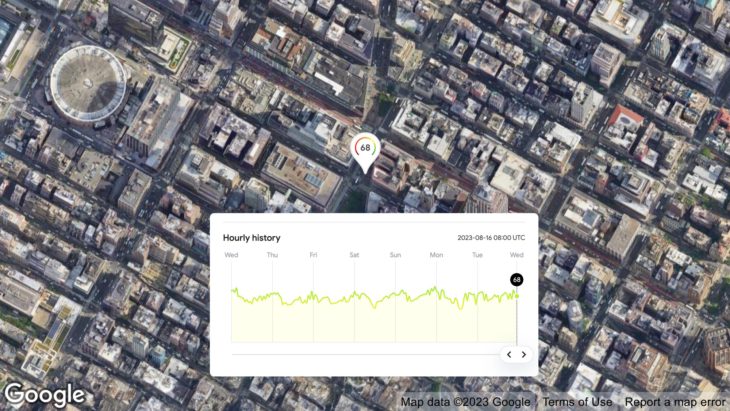
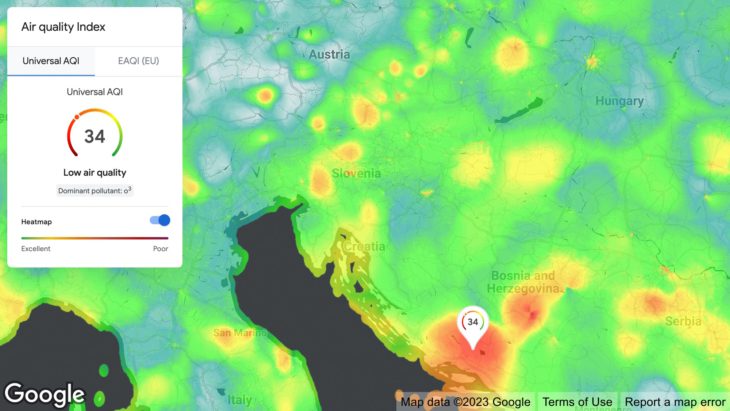
The current API, which focuses on air quality, is expanded geographically. Today you can analyze all of Europe (100 countries worldwide) to see how well each zone is performing and what the dominant “bad” factor is.
According to Google, this API validates and organizes terabytes of data per hour. In addition to government-monitored stations, the search giant also collects data from sensors and satellites to provide a local and universal number.
In addition to a general score and the most dominant pollutant, you can also see various other parameters, including CO, NO2, O3, PM10, PM25 and SO2. You can also view hourly history for a full week to estimate when quality is at its worst.
Detailed view of the survey
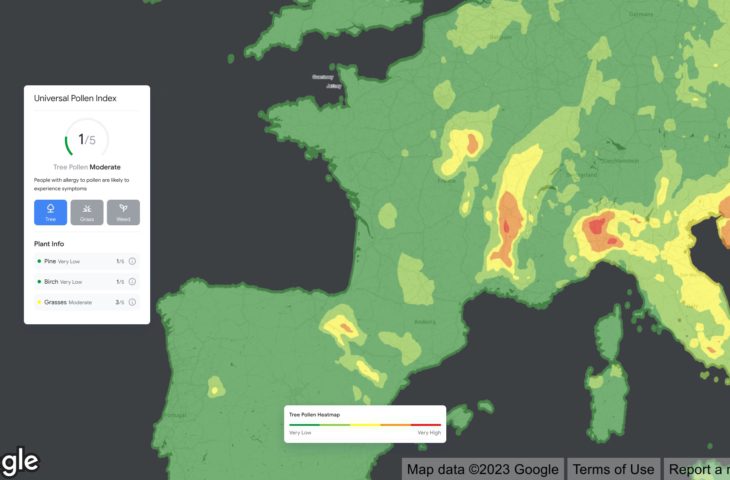
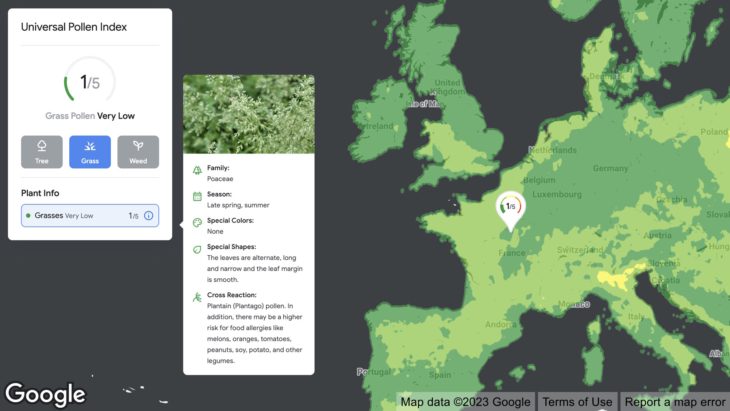
In addition to the substances emitted by humans, Google also measures pollen with the new APIs. According to Google, due to global warming and the increase in greenhouse gases, plants that produce pollen are growing in more places and their pollen production is increasing.
The Pollen API keeps track of which pollen is active, how intense, and in which areas. You can filter by trees, grasses or other plants. Google also shows useful information per plant, such as what it looks like, when the peak is at its highest, and any important information about an annoying or dangerous combination with other allergies.
With these three APIs, companies can integrate clear and up-to-date environmental data into their systems to develop sustainable products. Google makes the APIs available free of charge.
As an experienced journalist and author, Mary has been reporting on the latest news and trends for over 5 years. With a passion for uncovering the stories behind the headlines, Mary has earned a reputation as a trusted voice in the world of journalism. Her writing style is insightful, engaging and thought-provoking, as she takes a deep dive into the most pressing issues of our time.