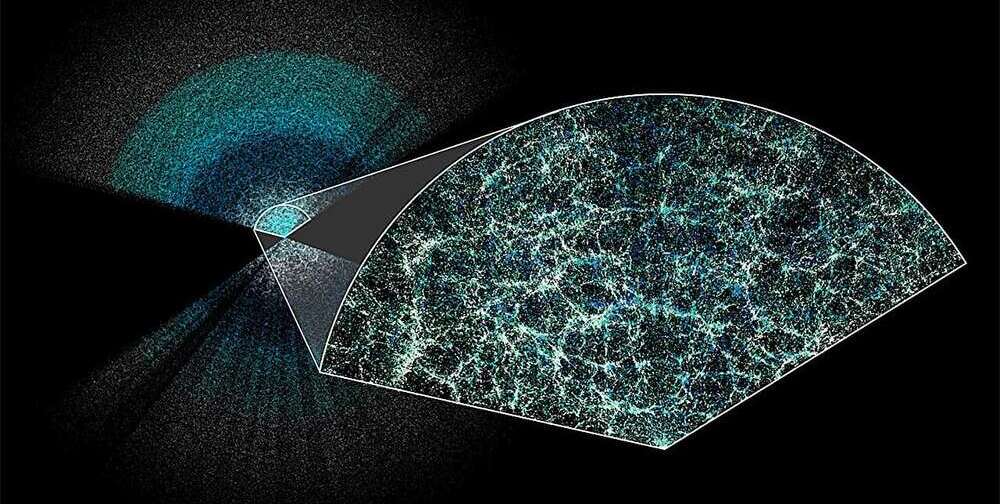
The results of the analysis of data collected during the first year of observations as part of the DESI survey have been published. This definitive galaxy map was created by studying the evolution of the universe, specifically its expansion under the influence of hypothetical dark energy. And judging by extremely preliminary results, dark energy is weakening.
DESI (Dark Energy Spectroscopic Instrument) is today’s most powerful spectrometer capable of collecting data on multiple objects simultaneously. Five thousand small “robots” direct their “eyes” to pre-selected galaxies. Thus, the vehicle manages to analyze a new part of five thousand galaxies in just 20 minutes. DESI can measure 100,000 galaxies in one night. The field of view is one-third of the sky.
The telescope became operational in 2021, and during its five-year operation the survey will collect data on 37 million galaxies and three million quasars. More than 10 articles have been published on the portal arXiv Scientists presented the results of data analysis for the first year of observations.
An important difference of the DESI project is the completely “blind analysis” of the data. When developing a code for analysis, scientists work with modified observational data. Only then the finished code is applied to clean data. This approach helps prevent unintentional bias.
Light from the most distant objects on the new map has been reaching Earth for eight to 11 billion years. Their spectra were collected with a record accuracy of 0.82%. The average accuracy of the data is 0.5%. DESI turned out to be twice as accurate at measuring the rate of expansion of the universe as the previous BOSS survey, conducted as part of the Sloan study.
The expansion of the universe is a sensitive issue for cosmology. A few decades ago, most scientists believed that gravitational interaction forces would eventually slow the expansion of the universe. But in 1998, physicists discovered that the most distant supernovae were fainter than they should be, based on their redshift. If the expansion slowed down, distant supernovae would be brighter. This is how the hypothesis of dark energy emerged, which can accelerate the expansion of the universe despite dark matter opposing gravity and “helping” gravity.
Therefore, scientists want to understand how the universe expands to understand dark energy. This can be done using baryon acoustic oscillations (BAO) – “ripples” in the distribution of matter on the scale of the entire cosmos. These fluctuations are a legacy of times when the universe was a sea of plasma. The smallest interactions merely created “ripples” in three-dimensional space, like pebbles thrown into water – a kind of bubbles.
The Universe cooled and expanded, and the frozen BAO “bubbles” expanded with it – no longer in the form of plasma density differences, but in the form of distribution over the Universal matter, i.e. galaxies. DESI collects data about galaxies, allowing scientists to measure BAO at different periods of the universe.
So far, scientists have divided DESI data into seven periods. They analyzed the distribution of ordinary galaxies because they are “close” to us. Their light dims as they get further away, so researchers used quasars to analyze BAOs in the early universe.
There are many clumps of material in the path between us and distant quasars that we cannot see, but they absorb the light of the quasars passing through them. Not the entire spectrum, but specific parts of the spectrum that correspond to hydrogen. These characteristic absorption traces in the range of distant objects are called the “Lyman-alpha forest”. So scientists created the BAO map of the early universe based on the spectra of 450,000 quasars (by the end of the DESI survey there will already be three million quasars).
Overall, the results of the first year of observations are consistent with the CDM standard cosmological model. However, DESI data alone do not allow us to accurately measure the evolution of dark energy. To improve accuracy, scientists took data from supernova surveys and used them to test another hypothesis: that dark energy is unstable.
The DESI data turned out to be more consistent with the time-varying dark energy hypothesis. However, the standard deviation of the results obtained did not reach the “gold standard”. In science, the “gold standard” for a discovery is a deviation of more than five sigma (these equal 99.9999 percent probability). Here, depending on the database, the authors obtained supernovae: 2.5 sigma, 3.5 sigma and 3.9 sigma.
“This is not yet a clear confirmation, but still the best data are consistent with the hypothesis that dark energy is changing. Interestingly, it is the one that best explains the first three points. [на графіку]. The dashed line suits us best and corresponds to a model in which dark energy is not constant, as in ΛCDM, but can change over time. “All the observations we have collected over the last 25 years suggest that a simple solution is probably best,” commented Nathalie Palanque-Delabrouille, a physicist at Lawrence National Laboratory in Berkeley and one of DESI’s press secretaries.


